Transform Your Business with Enterprise AI Solutions | VisionBot
Innovative Enterprise AI Solutions for Every Industry
Transforming Industries with Tailored AI Solutions
Real-World Applications
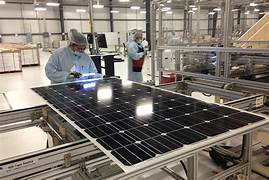
- Manufacturing: Incorporate predictive maintenance, quality control and supply chain optimisation into production lines.
- Healthcare: Use AI technologies to improve diagnostic instruments, treatment plans and healthcare systems for better patient care.
- Finance: Transform the financial sector and use AI algorithms for risk assessment, fraud detection as well as personalized banking services.
Why VisionBot's Enterprise AI?
Essentially, enterprises that choose VisionBot as their enterprise AI partner do so with a company who is an example of the best in innovation and development. We are the best choice for those businesses that need a change brought in by AI because of our total commitment to excellence and diverse industry footprint.
- Cutting-Edge Technology: Be ahead in innovation with our cutting-edge AI technologies.
- Expert Team: Collaborate with an AI team focused on knowing and fulfilling the needs of your business.
- Scalability and Flexibility: Our AI solutions will increase with time and hence they ll remain efficient as long you are doing business.
Elevate Your Business with VisionBot's Enterprise AI
Order a free demo now and witness the transformative power of enterprise AI with VisionBot’s solutions. Join the ranks of visionary businesses and let us guide you in unleashing the full potential of AI within your organization. VisionBot is shaping a future that’s not only bright but intelligently driven.
Optimization of Maintenance Schedule
ROI Example
- Reduce maintenance costs by 20.5%
- Reduce unplanned downtime by 30% to 50%
- Extend the lifetime of aging assets by 20%
- Achieve 27.5% up to 50% in energy savings
Data Needed
- Historical and Real-time Sensor Data per Machine. Examples: Temperature, Pressure, Vibration, Rotational Speeds, Current, Chemical Properties.
- Historical failure incidents and maintenance work orders.


Automated Visual Quality Inspections
ROI Example
- Annotation of Labelled Defect Images (Ideally Tens of Thousands).
- Model Training on annotated Datasets.
Data Needed
- Historical and Real-time Sensor Data per Machine. Examples: Temperature, Pressure, Vibration, Rotational Speeds, Current, Chemical Properties.
- Historical failure incidents and maintenance work orders.
Optimization of Maintenance Schedule
ROI Example
- 10-20% improvement in OTIF planning and scheduling performance
- 25% improvement in Ontime Delivery & customer satisfaction
- Reduced Delta between Sales and Production
- 15% reduction in rolling inventory levels
Data Needed
- Historical Production Yield data
- Historical Production Schedules used
- Order Booked
- Forecast
- Inventory schedules

Optimization of Production Process
A Trained model can detect complex correlation between these parameters and production rate. Further an generate optimal configuration to improve overall equipment effectiveness.
ROI Example
- 25 – 30 % production yield improvement.
- 5-10 % reduction in production costs.
- 5- 15 % improvement in Equipment uptime.
Data Needed
- Historic Production Data per Product: yield, parameter values per each production step, total time taken.
- Historic Sensor data: Boiler Load , voltage, pressure, temperature.
- Historic Maintenance data per Machine: work orders, failure.
Predictive Maintenance
Business Impact: reduce down time for vehicle and machines, improve safety, decrease spent time on unplanned maintenance, increase customer and driver satisfaction.
ROI Example
- Reduce Vehicle Downtime by 15%
- Reduce related delays by 10-15%.
- Reduce Idling times in Service Centres by 15-18%.
Data Needed
- Historical Vehicle Telemetry and Real-time Sensor data (e.g. vibration, voltage, pressure, temperature)
- Historical failures, dates of repairs (work orders), current status for machines and cargo carriers.


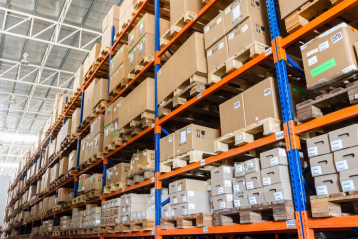
Demand Optimization
Business Impact
Demand sensing & Supply planning. Optimize Procurement orders based on forecasts. Increased sales with reduced inventories. No missed sales or stock outs.
ROI Example
- 20 to 30% Reduction in Forecasting Errors of Supply Chain Networks
- Up to 35% Reduction in Lost Sales due to inventory out-of-stock situations
- 10 to 40% Reduction in Warehousing Costs
Data Needed
- Historical Product Sales per stock point
- Product Attributes (e.g. price, category)
- Historical Promotions & Marketing Activities (optional)
- Supply Chain Assets data: trucks, routes , drivers, schedules
- Other data sets (optional): Seasonal, competition offers etc
Design Optimization
Business Impact
Take the guesswork out of your design process.
Generative Design uses AI to come up with multiple design variations for products or parts. This leads to faster generation of design options than would be developed through manual design, which leads to faster product development times and more creative choices.
ROI Example
- An auto company could create 150 new design ideas for a seat bracket. 40% lighter and 20% stronger than the original part
- A design house was able to create a new design that reduced the battery case weight by 40%
Data Needed
- Designs for Products or Parts of interest
- Images for Products and Parts.